The Claim
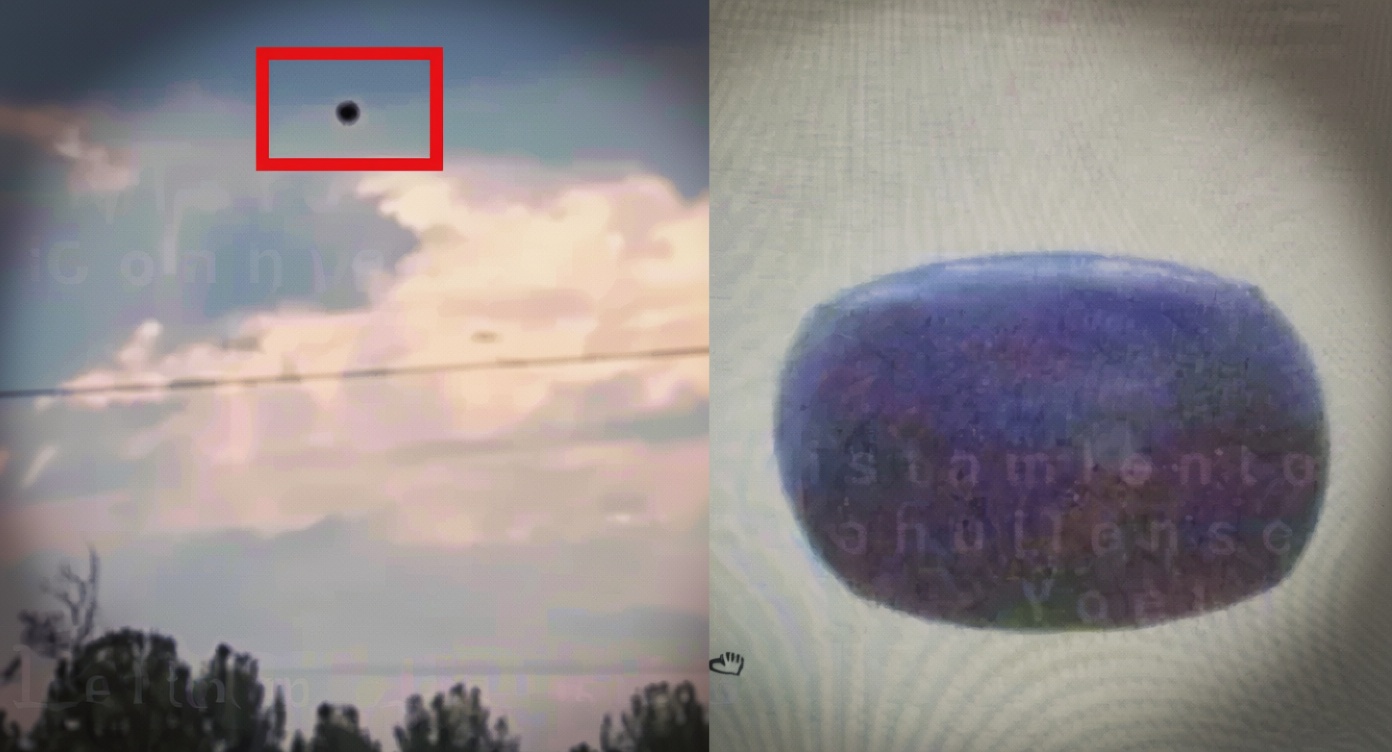
A UFO researcher’s interpretation of seafloor imagery off South Australia has drawn attention after he described a large, rectangular feature as an occupied alien base. Scott C. Waring, who publishes the blog UFO Sightings Daily, posted the image on Sept. 8, 2026, under the headline “10 Mile Long Alien Base Found In Ocean Off Australia.”
Waring identified the location only as “Ocean Below Australia” and provided no coordinates or independent survey data. He described the apparent formation as roughly 10 miles by four miles and speculated that it extended 10 to 15 miles beneath the seabed. “This alien base looks clean and taken care of, without any sand or sea growth covering it up,” Waring wrote, concluding that extraterrestrials were currently occupying the site.
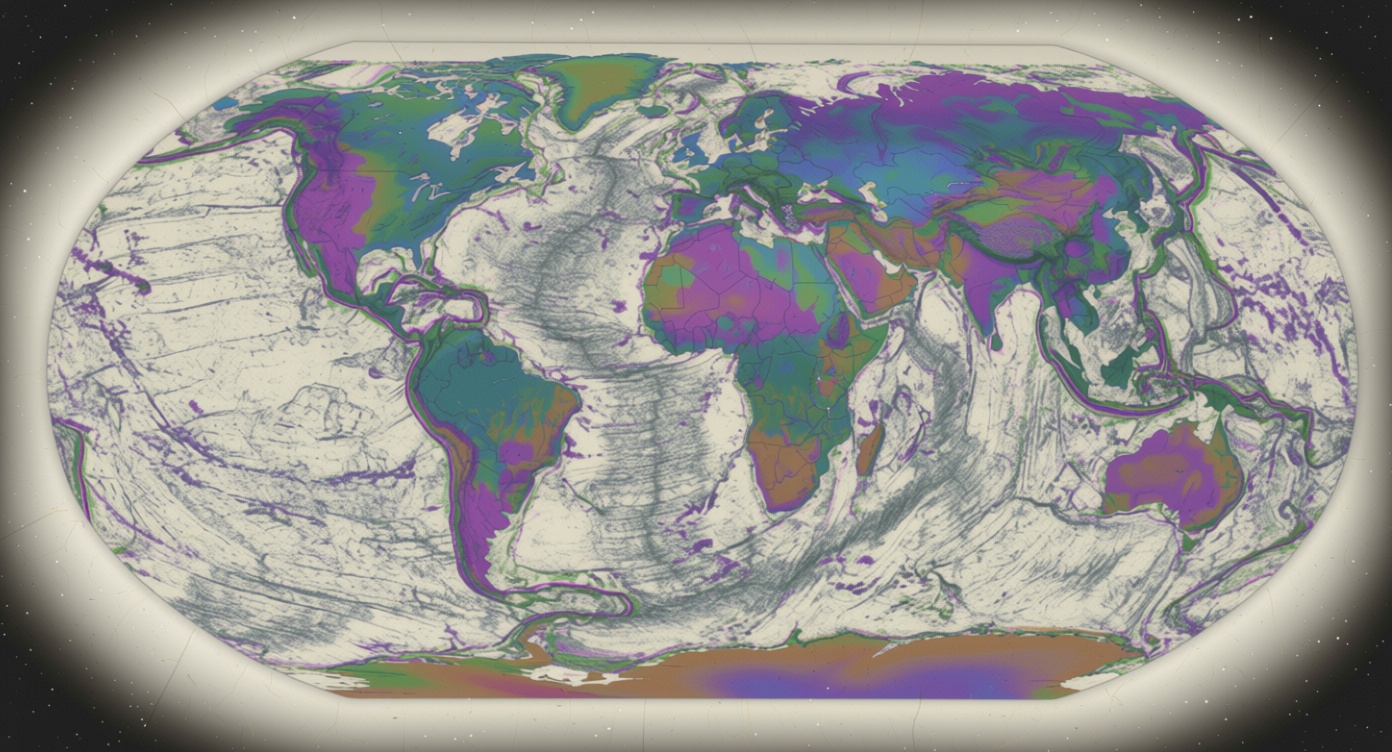
The post’s only cited source was the homepage of Seabed 2030, an international initiative working to create a publicly available map of the world’s ocean floor. The project’s mapping data can be viewed through online bathymetric platforms, where imagery may combine information gathered using different technologies and at different resolutions.
NOAA’s Explanation
The National Oceanic and Atmospheric Administration says straight lines and grid-like patterns visible in online seafloor maps are generally mapping artifacts, not physical structures. On a page addressing recurring questions about alleged underwater civilizations, NOAA explains that such features can appear when multiple data layers are placed over one another.
“One map may show a large, low-resolution picture of the ocean floor,” NOAA states. “This map will show little detail and will look smooth.” Higher-resolution sonar data are then displayed over portions of that background, creating visible boundaries between surveyed strips and less-detailed areas.
According to the agency, the apparent lines often trace the routes followed by survey vessels. They represent the edges of detailed sonar coverage rather than walls, roads or other constructions on the seabed. Similar patterns, including large grids northwest of the Canary Islands, have previously prompted speculation about lost civilizations despite being explained by the way ocean data are collected and displayed.
How the Patterns Form
Modern survey ships commonly use multibeam sonar, which sends numerous sound pulses outward in a fan-shaped pattern. The system measures the time required for the signals to return from the seabed, allowing researchers to calculate water depth across a broad swath beneath and alongside the ship.
As a vessel travels, each pass produces a long, relatively sharp strip of depth measurements. Where the strip ends, the surrounding map may revert to lower-resolution data, producing straight edges or rectangular patches. When several survey tracks intersect, the result can resemble a grid or a series of engineered lines.
Much of the broader ocean-floor map is derived from satellite measurements. Variations in the seafloor’s mass—such as seamounts and abyssal hills—slightly alter the gravitational field and produce subtle changes in the sea surface. Scientists can use those changes to infer large geological features, but satellite-derived maps are generally less detailed than direct sonar surveys.
Depth and Mapping Context
The depth claimed in Waring’s post also conflicts with established oceanographic measurements. NOAA Ocean Exploration identifies the deepest known point in the ocean as approximately 6.8 miles, or 11,000 meters, below sea level. A structure extending 10 to 15 miles downward would therefore exceed the depth of the deepest known ocean basin and would require extraordinary evidence.
Seabed 2030 reported on April 20, 2026, that 28.7 percent of the global ocean floor had been mapped, following the addition of nearly 5 million square kilometers of data. The continuing expansion of high-resolution surveys is expected to improve the accuracy of ocean maps—but it also means online visualizations may combine older satellite models with newer, narrow sonar tracks.
No evidence presented in the blog post establishes that the South Australian feature is a physical installation, artificial structure or extraterrestrial facility. Based on NOAA’s explanation, the lines are most plausibly the visible boundaries of ship-based sonar coverage layered over a lower-resolution map.