Overview
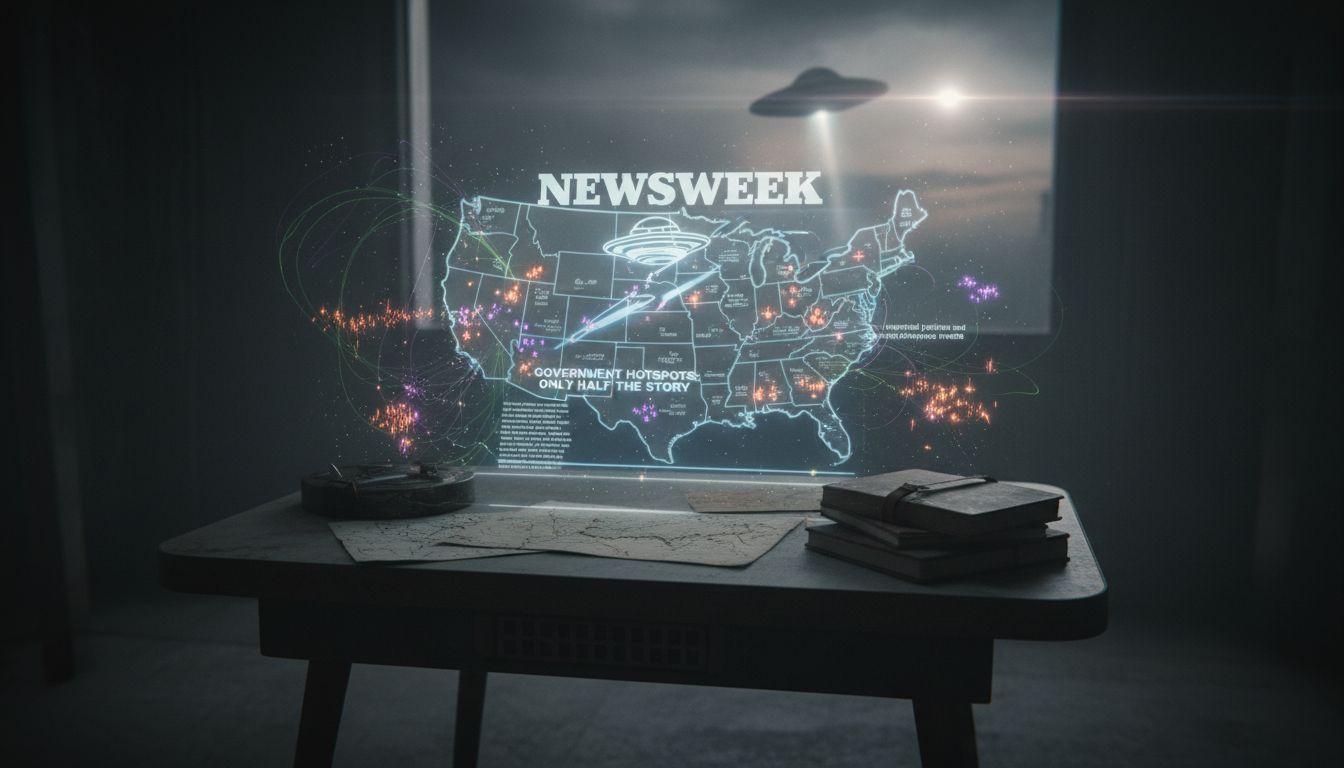
A recent Newsweek feature highlighted a government‑produced map that pinpoints “UFO sighting hotspots” across the United States, drawing public attention to regions where unidentified aerial phenomena (UAP) reports have clustered. While the map offers a useful visual summary of official data, a parallel analysis published on What Then Studio on March 9, 2026 argues that the map tells only half the story. The blog post contends that the official hotspots omit a substantial body of “high‑strangeness” events and patterns emerging from less‑studied fringe areas, raising questions about the completeness of current UAP reporting mechanisms.
Official Hotspot Data
The government’s hotspot map is derived from the Department of Defense’s UAP reporting system and the civilian National UFO Reporting Center (NUFORC) database. According to the map, the most frequently reported sightings concentrate around three corridors: the Pacific Northwest, the Great Lakes region, and the Southern Nevada‑Arizona border. These zones align with historical “lights‑out” corridors identified in the 2021 Pentagon UAP report, which noted higher incident rates near major military installations and flight corridors.
Government officials emphasize that the map reflects verified submissions—reports that have passed an initial credibility filter, include radar corroboration, or feature multiple independent witnesses. “Our goal is to provide a transparent, data‑driven picture of where UAP activity is most observable,” a spokesperson for the Office of the Under Secretary of Defense for Intelligence and Security told Newsweek.
Gaps and Unreported Patterns
The What Then Studio article points out several methodological blind spots. First, it notes that rural and remote regions—such as the high deserts of Utah, the Appalachian backcountry, and the expansive plains of the Midwest—receive far fewer reports, not necessarily because incidents are rarer, but because reporting infrastructure is limited. Residents in these areas often lack access to the online portals used by the DoD and NUFORC, and may be hesitant to submit sightings for fear of social stigma.
Second, the blog highlights “high‑strangeness” events—cases that involve physical trace evidence, electromagnetic interference, or prolonged encounters—that are typically excluded from the hotspot calculations. “When a farmer finds scorched soil or a rancher experiences equipment failure coinciding with a luminous object, the incident is often labeled ‘unverified’ and never makes it onto the official map,” the article asserts, quoting longtime ufologist Dr. Elena Marquez of the Center for Aerial Anomaly Studies.
Finally, the piece argues that temporal clustering—short bursts of activity over weeks or months—gets smoothed out in the static hotspot visualization. “A spike in sightings over a particular weekend can be lost in the annual averages, masking potentially significant patterns linked to atmospheric or technological variables,” Marquez adds.
Community Perspective
UFO enthusiasts and independent researchers have taken up the call to broaden the data set. Online forums such as UFO‑Net and the High Strangeness Collective have begun crowdsourcing “shadow reports” that include audio recordings, drone footage, and even citizen‑science measurements of geomagnetic anomalies. One contributor, known only as “SkyWatcher88,” posted a series of night‑time videos from the Ozark Highlands—a region absent from the government map—showing synchronized, pulsating lights that appeared over a ten‑day period in February 2026.
These grassroots efforts aim to complement official databases rather than replace them, offering a more nuanced picture of where and how UAP phenomena manifest. “We’re not trying to sensationalize,” says Mike Alvarez, moderator of the High Strangeness Collective. “Our objective is to provide the missing context that official channels, by design, filter out.”
Implications for Policy and Research
The divergence between the official hotspot map and the broader, community‑generated data underscores a policy challenge: how to balance rigorous verification with inclusivity of anomalous reports. Analysts suggest that expanding the reporting framework to incorporate anonymous submissions, mobile app interfaces, and regional liaison officers could reduce geographic bias. Moreover, integrating “high‑strangeness” criteria into the analytical models may reveal correlations with electromagnetic disturbances, weather patterns, or even classified testing activities.
As the U.S. government continues to grapple with the UAP threat assessment outlined in the 2021 and 2023 reports, the call for a more comprehensive mapping approach gains traction. “If we’re to understand the full scope of aerial anomalies, we need to look beyond the bright spots on the map and listen to the quieter, often overlooked corners,” Dr. Marquez concludes. The ongoing dialogue between official agencies and the civilian research community may ultimately produce a more complete and actionable picture of the nation’s UFO landscape.